Practical guide
Can You Calculate a Water-Quality Average From Its Range?
Read the statistic’s definition, use complete fictional counterexamples, and keep a missing mean unresolved rather than substituting the midpoint.
First identify what the report means by “average”
A water report’s minimum and maximum do not normally tell you its arithmetic mean. Taking the middle of the range gives the midrange, a different statistic. To calculate a mean, you need the appropriate results, their counting or weighting rule, and the treatment of non-numeric entries.
Start with the report’s introduction, column headings and footnotes. “Average” may describe a mean of detected values, a highest monthly average or a highest locational running annual average. Those quantities cannot be reconstructed with the same shortcut.
New York City’s 2025 report illustrates the importance of that check. Its introduction describes ranges and averages unless otherwise footnoted. Footnote 16 specifies a different meaning for the TTHM and HAA5 rows: their “Average” column contains the highest locational running annual average. Their range covers individual results from monitored sites. Read that exception before opening a spreadsheet.[1]
Four complete results prove why the endpoints are insufficient
The following small datasets are invented, exact numeric concentrations in µg/L for one unspecified analyte. They are teaching examples, not laboratory results, utility data or health thresholds. Every result is included; there are no hidden samples or ND values.
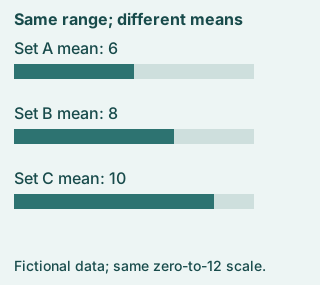
A, B and C each contain four results and the same range, 4–12 µg/L. Their means are 6, 8 and 10 µg/L. Even knowing the number of samples does not resolve the missing values between the endpoints.
On a narrow screen, scroll inside the table to read the final column. Keyboard users can focus it and press the right-arrow key.
| Set | All four results (µg/L) | Minimum–maximum | Arithmetic mean |
|---|---|---|---|
| A | 4, 4, 4, 12 | 4–12 | 24 ÷ 4 = 6 |
| B | 4, 8, 8, 12 | 4–12 | 32 ÷ 4 = 8 |
| C | 4, 12, 12, 12 | 4–12 | 40 ÷ 4 = 10 |
| D | 6, 6, 10, 10 | 6–10 | 32 ÷ 4 = 8 |
A midpoint is a description of the extremes
For the 4–12 range, the midrange is (4 + 12) ÷ 2 = 8 µg/L. That happens to equal B’s mean, but it misses A’s and C’s means. Equality in one example does not establish a general formula.
The range also answers a different question from the mean: how far apart are the recorded extremes? B and D have the same mean of 8 µg/L, but B spans 4–12 while D spans 6–10. A mean alone therefore does not recover the full spread either.
There are cases where the endpoints are sufficient. If exactly two included numeric samples are known, their minimum and maximum are the two values, so their mean is the midrange. That premise is absent from a general range with more samples. Another narrow arithmetic exception: if every included numeric result is known to be exactly the same value, its mean is that value. A rounded display such as “7–7” does not prove all original measurements were identical; nor does “ND–ND” supply two measured zeros.
Counts, sampling periods and ND handling still matter
An arithmetic sample mean is the sum of the included numeric results divided by their number. The word “included” matters. Are these all samples, only detections, one monitoring location, or a particular period? Does the table omit quality-control samples or describe a prescribed compliance statistic?
If a report gives several group means, their plain average need not equal the mean of all individual samples. A group with ten samples contributes more samples than a group with one. A regulatory calculation may instead prescribe averaging within a quarter and then across quarters. Do not choose a weighting rule merely because it gives a convenient number.
ND means the report has not supplied an exact numeric concentration under its stated convention. Do not silently substitute zero, half the reporting limit or the limit itself. Obtain the issuer’s method for the particular statistic. The ND interpretation guide explains the result boundary; it does not invent a universal averaging convention.
A useful request names the missing information
If your purpose is simply to read a reported statistic, preserve its label, units, sampling period and footnote rather than trying to recreate it from a range. If you need to reproduce a calculation, ask the utility or laboratory for the relevant individual results and the calculation method.
A precise request is: “For the named analyte and reporting period, which results and locations contribute to this average? Are results first grouped by quarter? How are ND values and excluded samples handled? Is the published number rounded?” That gives the issuer something concrete to clarify.
When only the range is available, write “mean not recoverable from the supplied summary.” You may state the minimum and maximum exactly as reported. You may also compute a clearly labelled midrange for a numeric range, but it remains a midrange and does not become an exposure estimate or compliance finding.
For a specific apparent contradiction between a TTHM peak and the reported MCL status, use the maximum-versus-LRAA guide. An annual report cannot override a current advisory or describe unknown plumbing at your address.[2]
Check three proposed summaries
Case 1
A report supplies four samples and a range of 4–12 µg/L. Is an 8 µg/L mean established?
Show answer and explanation for case 1
No. 8 µg/L is the midrange, not an identified mean.
The complete invented sets A and C have the same count and endpoints but means 6 and 10. The omitted internal values decide the arithmetic mean.
Case 2
B and D both have an 8 µg/L mean. Do they have the same observed spread?
Show answer and explanation for case 2
No. B spans 4–12; D spans 6–10.
Their equal means do not recover their extremes. Keep the statistic’s identity instead of replacing a range with a mean.
Case 3
Every included exact numeric result is 7 µg/L. What is their arithmetic mean?
Show answer and explanation for case 3
7 µg/L, provided the stated identical numeric results and inclusion rule are actually known.
The sum of n identical values is 7 × n, so (7 × n) ÷ n = 7. A rounded “7–7” display or ND entries would not supply the same premise.
Sources and further reading
- NYC DEP — 2025 Drinking Water Supply and Quality ReportPDF pages 12, 15, 18 (printed 10, 13, 16) read in full, including table headings and footnote 16. The rest of this 20-page report was not adopted here. These historical results concern NYC’s reported 2025 supply, not your current tap.
- EPA — CCR Information for ConsumersCommunity-system report scope and contents; complete main text checked 8 November 2026. An annual report remains separate from current supply instructions.