Practical guide
TTHM Maximum Above the Limit? Read the LRAA Before Comparing
Separate individual maxima from the highest LRAA, work through location and quarter calculations, and read the exceptions before drawing a conclusion.
Read the actual TTHM row together with footnote 16
A highest TTHM sample above 80 µg/L does not, by itself, answer every compliance question. For a system subject to quarterly Stage 2 monitoring, the relevant MCL calculation uses locational running annual averages (LRAAs). The individual maximum and the highest LRAA describe different sets of operations.
New York City’s 2025 report provides a concrete historical example. Its TTHM row lists 298 samples, a 4–81 µg/L range, 52 µg/L in the “Average” column and “No” in the MCL-violation column. Footnote 16 says that the range includes minimum and maximum individual values across monitored distribution sites, whether for compliance purposes or not. The “Average” column is the highest LRAA.[1]
This is a reading of the issued report, not an independent audit of NYC compliance or a measurement of your tap. The 81 and 52 are not interchangeable. The table below preserves the two row definitions instead of treating 52 as the plain mean of all 298 results.
On a narrow screen, scroll inside the table to read the final column. Keyboard users can focus it and press the right-arrow key.
| Parameter | Individual range (µg/L) | Highest LRAA (µg/L) | Listed MCL (µg/L) | Report MCL violation |
|---|---|---|---|---|
| TTHM | 4–81 | 52 | 80 | No |
| HAA5 | 7–64 | 47 | 60 | No |
“Locational” prevents a system-wide average from hiding a location
EPA’s guide distinguishes the Stage 1 system running annual average from the Stage 2 locational running annual average. For the quarterly calculation, keep each monitoring location separate. One low location cannot simply cancel a higher location by pooling every result across the system.[3]
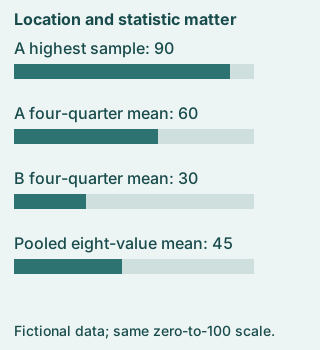
In the invented model below, one specified result is supplied for each of four consecutive quarters at each location. All concentrations are exact µg/L values. A’s four-quarter mean is 60; B’s is 30. Their pooled mean is 45, which describes the combined eight values and is not A’s LRAA. These are explanatory calculations, not compliance results for a real system.
On a narrow screen, scroll inside the table to read the final column. Keyboard users can focus it and press the right-arrow key.
| Location | Quarter 1 | Quarter 2 | Quarter 3 | Quarter 4 | Four-quarter mean |
|---|---|---|---|---|---|
| A | 40 | 50 | 90 | 60 | (40 + 50 + 90 + 60) ÷ 4 = 60 |
| B | 20 | 30 | 40 | 30 | (20 + 30 + 40 + 30) ÷ 4 = 30 |
Several samples in one quarter require an extra step
The reproduced text of 40 CFR 141.620(d)(1) says that, when more than one sample is taken in a quarter at a monitoring location, the samples in that quarter are averaged to obtain the quarterly value used in the LRAA. Then the relevant quarterly values enter the annual calculation.[2]
Suppose fictional A instead has two Quarter 1 results, 20 and 60, while its other quarters remain 50, 90 and 60. Quarter 1’s mean is 40. The four quarterly means remain 40, 50, 90, 60, so the illustrated LRAA remains 60 µg/L. Pooling the five raw samples gives 280 ÷ 5 = 56 µg/L, a different calculation.
This is why both the sample dates and locations are needed to reproduce the statistic. A range, a sample count or an annual row cannot supply the missing grouping. The range-and-average guide shows another reason a summary cannot reconstruct the source data.
Do not extend the quarterly example to every system
The four-value model assumes four available consecutive quarterly values. Section 141.620 also addresses missing monitoring and systems required to monitor yearly or less frequently. For quarterly systems with incomplete monitoring, the cited text uses available data from the most recent four quarters; missing monitoring can itself violate monitoring requirements. A missing quarter is not a measured zero.[2]
For required yearly or less-frequent monitoring, the same section specifies a different sample-based route and follow-up when a sample exceeds the MCL. Therefore,“a single peak never matters” is an incorrect rule. Identify the system’s applicable monitoring schedule before interpreting a result.
An OEL is another distinct calculation. A recent peak may require operational evaluation even when a four-quarter LRAA is lower. The OEL-versus-LRAA guide explains that weighted statistic; an LRAA discussion should not erase other required actions.
A reliable reading finishes with the issuer’s explanation
Keep the contaminant name and units, the raw-result range, the precise reported statistic, its location and period, applicable monitoring conditions, and the violation or action narrative. For TTHM, EPA’s primary-standard page lists 0.080 mg/L, equivalent to 80 µg/L; HAA5 is 0.060 mg/L, equivalent to 60 µg/L. Unit equivalence does not change the compliance basis.[4]
If a row looks inconsistent, ask the utility which result is compared to the MCL and where the report defines it. Do not announce a violation from the maximum alone, dismiss a current notice because an annual average is lower, or assume that the printed annual value reconstructs every sampling location.
The useful conclusion for the historical NYC row is limited: “The report defines 52 µg/L as its highest TTHM LRAA, separately lists a 4–81 µg/L individual range, and reports no MCL violation.” That statement preserves what the source says. It does not establish present conditions at your address.
Three checks using the stated data
Case 1
Does 81 µg/L in NYC’s 2025 TTHM range mean the “Average” column must also be 81?
Show answer and explanation for case 1
No. Footnote 16 defines the column as the highest LRAA, reported as 52 µg/L.
The range summarizes individual values across sites; the LRAA is a location-and-period calculation. The two columns need not match.
Case 2
May the fictional pooled mean of 45 replace A’s four-quarter mean of 60?
Show answer and explanation for case 2
No. The 45 value pools A and B, while A’s location calculation is 60.
A low result from B cannot be silently added to A’s monitoring series. Preserve the location required by the statistic.
Case 3
With fictional Quarter 1 samples 20 and 60 and later quarterly values 50, 90, 60, is 56 the quarter-based annual mean?
Show answer and explanation for case 3
No. The quarterly values are 40, 50, 90, 60, giving 60.
56 is the mean of the five raw samples. The stated quarterly procedure first averages 20 and 60 into one Quarter 1 value.
Sources and further reading
- NYC DEP — 2025 Drinking Water Supply and Quality ReportPDF pages 12, 15, 18 (printed 10, 13, 16) read in full, including table headings and footnote 16. The rest of this 20-page report was not adopted here. These historical results concern NYC’s reported 2025 supply, not your current tap.
- Cornell LII — 40 CFR 141.620, General requirementsComplete section text checked 8 November 2026. Paragraph (d) distinguishes quarterly monitoring, within-quarter averaging, available-data calculations and less-frequent monitoring. Cornell reproduces the CFR; this is not a site-issued compliance ruling.
- EPA — Comprehensive Stage 1 and Stage 2 DBPR Quick Reference GuideEPA 816-F-10-080, August 2010. All four rendered pages read, including tables 3–5 and footnotes. Used for the explained statistics; historical deadlines are not presented as new obligations.
- EPA — National Primary Drinking Water RegulationsComplete main text checked 8 November 2026; TTHM 0.080 mg/L and HAA5 0.060 mg/L listed. Applicable monitoring conditions and state requirements must also be read.